Probabilities and calibration
A probability is only useful if it means what it says. A model that answers “0.95” on questions it gets right 70% of the time is overconfident, and every downstream rule built on that 0.95 (“automate above 0.9”) will quietly fail.
Curva’s probabilities are calibrated on your own data: when a calibrated Curva answer says 0.9, it is right about 90% of the time on the questions you send it.
What calibration means
Section titled “What calibration means”Group every answer by its confidence, then compare each group’s confidence with how often it was actually right. Plotted, that is the calibration curve (a reliability diagram). A perfectly calibrated model sits on the diagonal.
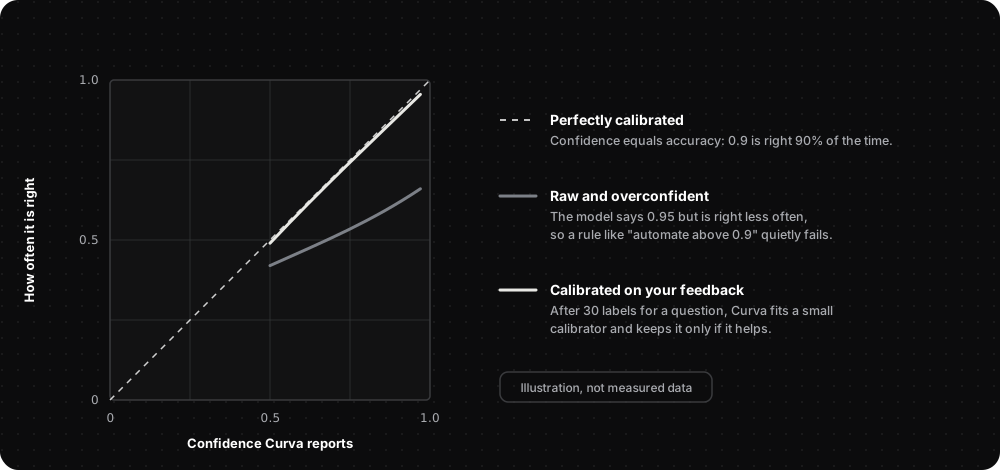
Curva reports three numbers:
| Metric | Meaning | Better |
|---|---|---|
| ECE (expected calibration error) | The average gap between confidence and accuracy, weighted by how many answers fall in each bin | Lower (0 = perfect) |
| Brier score | The mean squared error of the probabilities | Lower |
| Accuracy when automated | Accuracy on the answers at or above 0.9 confidence, and the share of answers that reach it | Higher |
How Curva calibrates
Section titled “How Curva calibrates”- You send the true answer for past decisions with
/v1/feedback. - After 30 labels for the same exact question in a project, Curva fits a calibrator:
- Temperature scaling for Choice and Score: one parameter that softens or sharpens the whole distribution.
- Bias scaling for Choice and Score with up to 20 options: temperature plus a small per-answer offset. It fixes a model that favours one answer (for example always “not the asshole”, or 5 stars too often), so it can change which answer comes first, not just how sure Curva is. Curva uses it only when held-out labels show it beats temperature alone.
- Platt scaling for Noul: a logistic fit on P(yes).
- If the calibrator helps (see below), every later answer to that question is adjusted and
comes back with
calibrated: true. The calibrator is refitted as new labels arrive.
Calibration is applied only when it improves the held-out accuracy of the probabilities: Curva
fits it on four fifths of the labels, scores it on the fifth it has not seen, five times over, and
keeps it only if it lowers the log-loss by at least 1%, the gain in both log-loss and Brier score
is clearly larger than its own noise (above 1.28 standard errors, so a lucky fold can’t switch it
on), and the labels show the raw probabilities are off by more than chance (a score test at the 1%
level). Otherwise answers stay raw, with
calibrated: false, since an already well-calibrated model is best left alone. With
few labels it also moves cautiously: probabilities move only part of the way to what the labels
suggest (about a third with 30 labels, nearly all the way with 1,000).
These are deliberately small models: one or two parameters each, or one per answer for bias scaling, so they fit well from a few dozen labels and can’t overfit the way a large model would.
Why per exact question
Section titled “Why per exact question”Calibrators are keyed by a fingerprint of the question’s type, wording and options. Rewording a question starts a fresh calibration, because a model’s behaviour changes with wording: published accuracy on one benchmark ranged from 62.6% to 95% by wording alone.
They are also kept per project, so two teams asking the same question about different data each get their own calibration.
Honest numbers
Section titled “Honest numbers”GET /v1/calibration reports accuracy, ECE, Brier and
reliability bins before and after calibration. The “after” numbers are held out: each
half of the labels is calibrated by a fit on the other half, so they aren’t flattered by testing
on the data the calibrator was fitted to.
Curva’s calibration code is covered by tests: an overconfident model goes from ECE 0.25 to under 0.03 with 1,000 labels, a yes/no model that always says 1.0 moves to its true 70% as labels accumulate, and a model that is already calibrated keeps its raw probabilities.


Documentation for everything Tarkova makes.
© 2026 Tarkova Private Limited.